Highlights from the World Inequality Report 2026 (WIR 2026)
The World Inequality Report 2026 (WIR 2026) marks the third edition in this flagship series, following the 2018 and 2022 editions. These reports draw from the work of over 200 scholars from all over the world, affiliated with the World Inequality Lab and contributing to the largest database on the historical evolution of global inequality. This collective endeavor represents a significant contribution to global discussions on inequality. The team has helped reshape how policymakers, scholars, and citizens understand the scale and causes of inequality, foregrounding the separatism of the global rich and the urgent need for top-end tax justice. Their findings have informed national and international debates on fiscal reform, wealth taxation, and redistribution in forums from national parliaments to the G20.
Building on that foundation, WIR 2026 expands the horizon. It explores new dimensions of inequality that define the 21st century: climate and wealth, gender disparities, unequal access to human capital, the asymmetries of the global financial system, and the territorial divides that are redrawing democratic politics. Together, these themes reveal that inequality today is not confined to income or wealth; it affects every domain of economic and social life.
The global inequality in access to human capital remains enormous today, likely a much wider gap than most people would imagine. Average education spending per child in Sub Saharan Africa stood at around just €200 (purchasing power parity, PPP), compared with €7,400 in Europe and €9,000 in North America & Oceania: a gap of more than 1 to 40, i.e., approximately three times as much as the gap in per capita GDP. Such disparities shape life chances across generations, entrenching a geography of opportunity that exacerbates and perpetuates global wealth hierarchies.
The report also shows that contributions to climate change are far from evenly distributed. While public debate often focuses on emissions associated with consumption, new studies have revealed how capital ownership1 plays a critical role in the inequality of emissions. The global wealthiest 10% of individuals account for 77% of global emissions associated with private capital ownership, underscoring how the climate crisis is inseparable from the concentration of wealth. Addressing it requires a targeted realignment of the financial and investment structures that fuel both emissions and inequality.
Gender inequality also looks starkly different if we take into account invisible, unpaid labor, which is disproportionately undertaken by women. When unpaid domestic and care labor is included, the gap widens sharply. On average, women earn only 32% of what men earn per working hour, accounting for both paid and unpaid activities; compared to 61% when not accounting for unpaid domestic labor. These findings reveal not only persistent discrimination but also deep inefficiencies in how societies value and allocate labor.
At the international level, WIR 2026 documents how the global financial system reinforces inequality. Wealthy economies continue to benefit from an “exorbitant privilege”: each year, around 1% of global GDP (approximately three times as much as development aid) flows from poorer to richer nations through net foreign income transfers associated with persistent excess yields and lower interest payments on rich-country liabilities. Reversing this dynamic is central to any credible strategy for global equity.
Finally, the report highlights the rise of territorial divides within countries. In many advanced democracies, gaps in political affiliations between large metropolitan centers and smaller towns have reached levels unseen in a century. Unequal access to public services, job opportunities, and exposure to trade shocks has fractured social cohesion and weakened the coalitions necessary for redistributive reform.
Besides a wealth of novel data, WIR 2026 provides a framework for understanding how economic, environmental, and political inequalities intersect. It calls for renewed global cooperation to tackle these divides at their roots: through progressive taxation, investment in human capabilities, climate accountability tied to private capital ownership, and inclusive political institutions capable of rebuilding trust and solidarity.
Inequality has long been a defining feature of the global economy, but by 2025, it has reached levels that demand urgent attention. The benefits of globalization and economic growth have flowed disproportionately to a small minority, while much of the world’s population still face difficulties in achieving stable livelihoods. These divides are not inevitable. They are the outcome of political and institutional choices.
This report draws on the World Inequality Database and new research to provide a comprehensive picture of inequality across income, wealth, gender, international finance, climate responsibility, taxation, and politics2.
The findings are clear: inequality remains extreme and persistent; it manifests across multiple dimensions that intersect and reinforce one another; and it reshapes democracies, fragmenting coalitions and eroding political consensus. Yet the data also demonstrate that inequality can be reduced. Policies such as redistributive transfers, progressive taxation, investment in human capital, and stronger labor rights have made a difference in some contexts. Proposals such as minimum wealth taxes on multi-millionaires illustrate the scale of resources that could be mobilized to finance education, health, and climate adaptation. Reducing inequality is not only about fairness but also essential for the resilience of economies, the stability of democracies, and the viability of our planet.
The world is extremely unequal
The first and most striking fact emerging from the data is that inequality remains at very high levels. Figure 1 illustrates that, today, the top 10% of the global population’s income-earners earn more than the remaining 90%, while the poorest half of the global population captures less than 10% of the total global income. Wealth is even more concentrated: the top 10% own three-quarters of global wealth, while the bottom half holds only 2%.


The picture becomes even more extreme when we move beyond the top 10%. Figure 2 illustrates that the wealthiest 0.001% alone, fewer than 60,000 multi-millionaires, control today three times more wealth than half of humanity combined. Their share has grown steadily from almost 4% in 1995 to over 6% today, which underscores the persistence of inequality.

This concentration is not only persistent, but it is also accelerating. Figure 3 shows that extreme wealth inequality is rapidly increasing. Since the 1990s, the wealth of billionaires and centi-millionaires has grown at approximately 8% annually, nearly twice the rate of growth experienced by the bottom half of the population. The poorest have made modest gains, but these are overshadowed by the extraordinary accumulation at the very top.
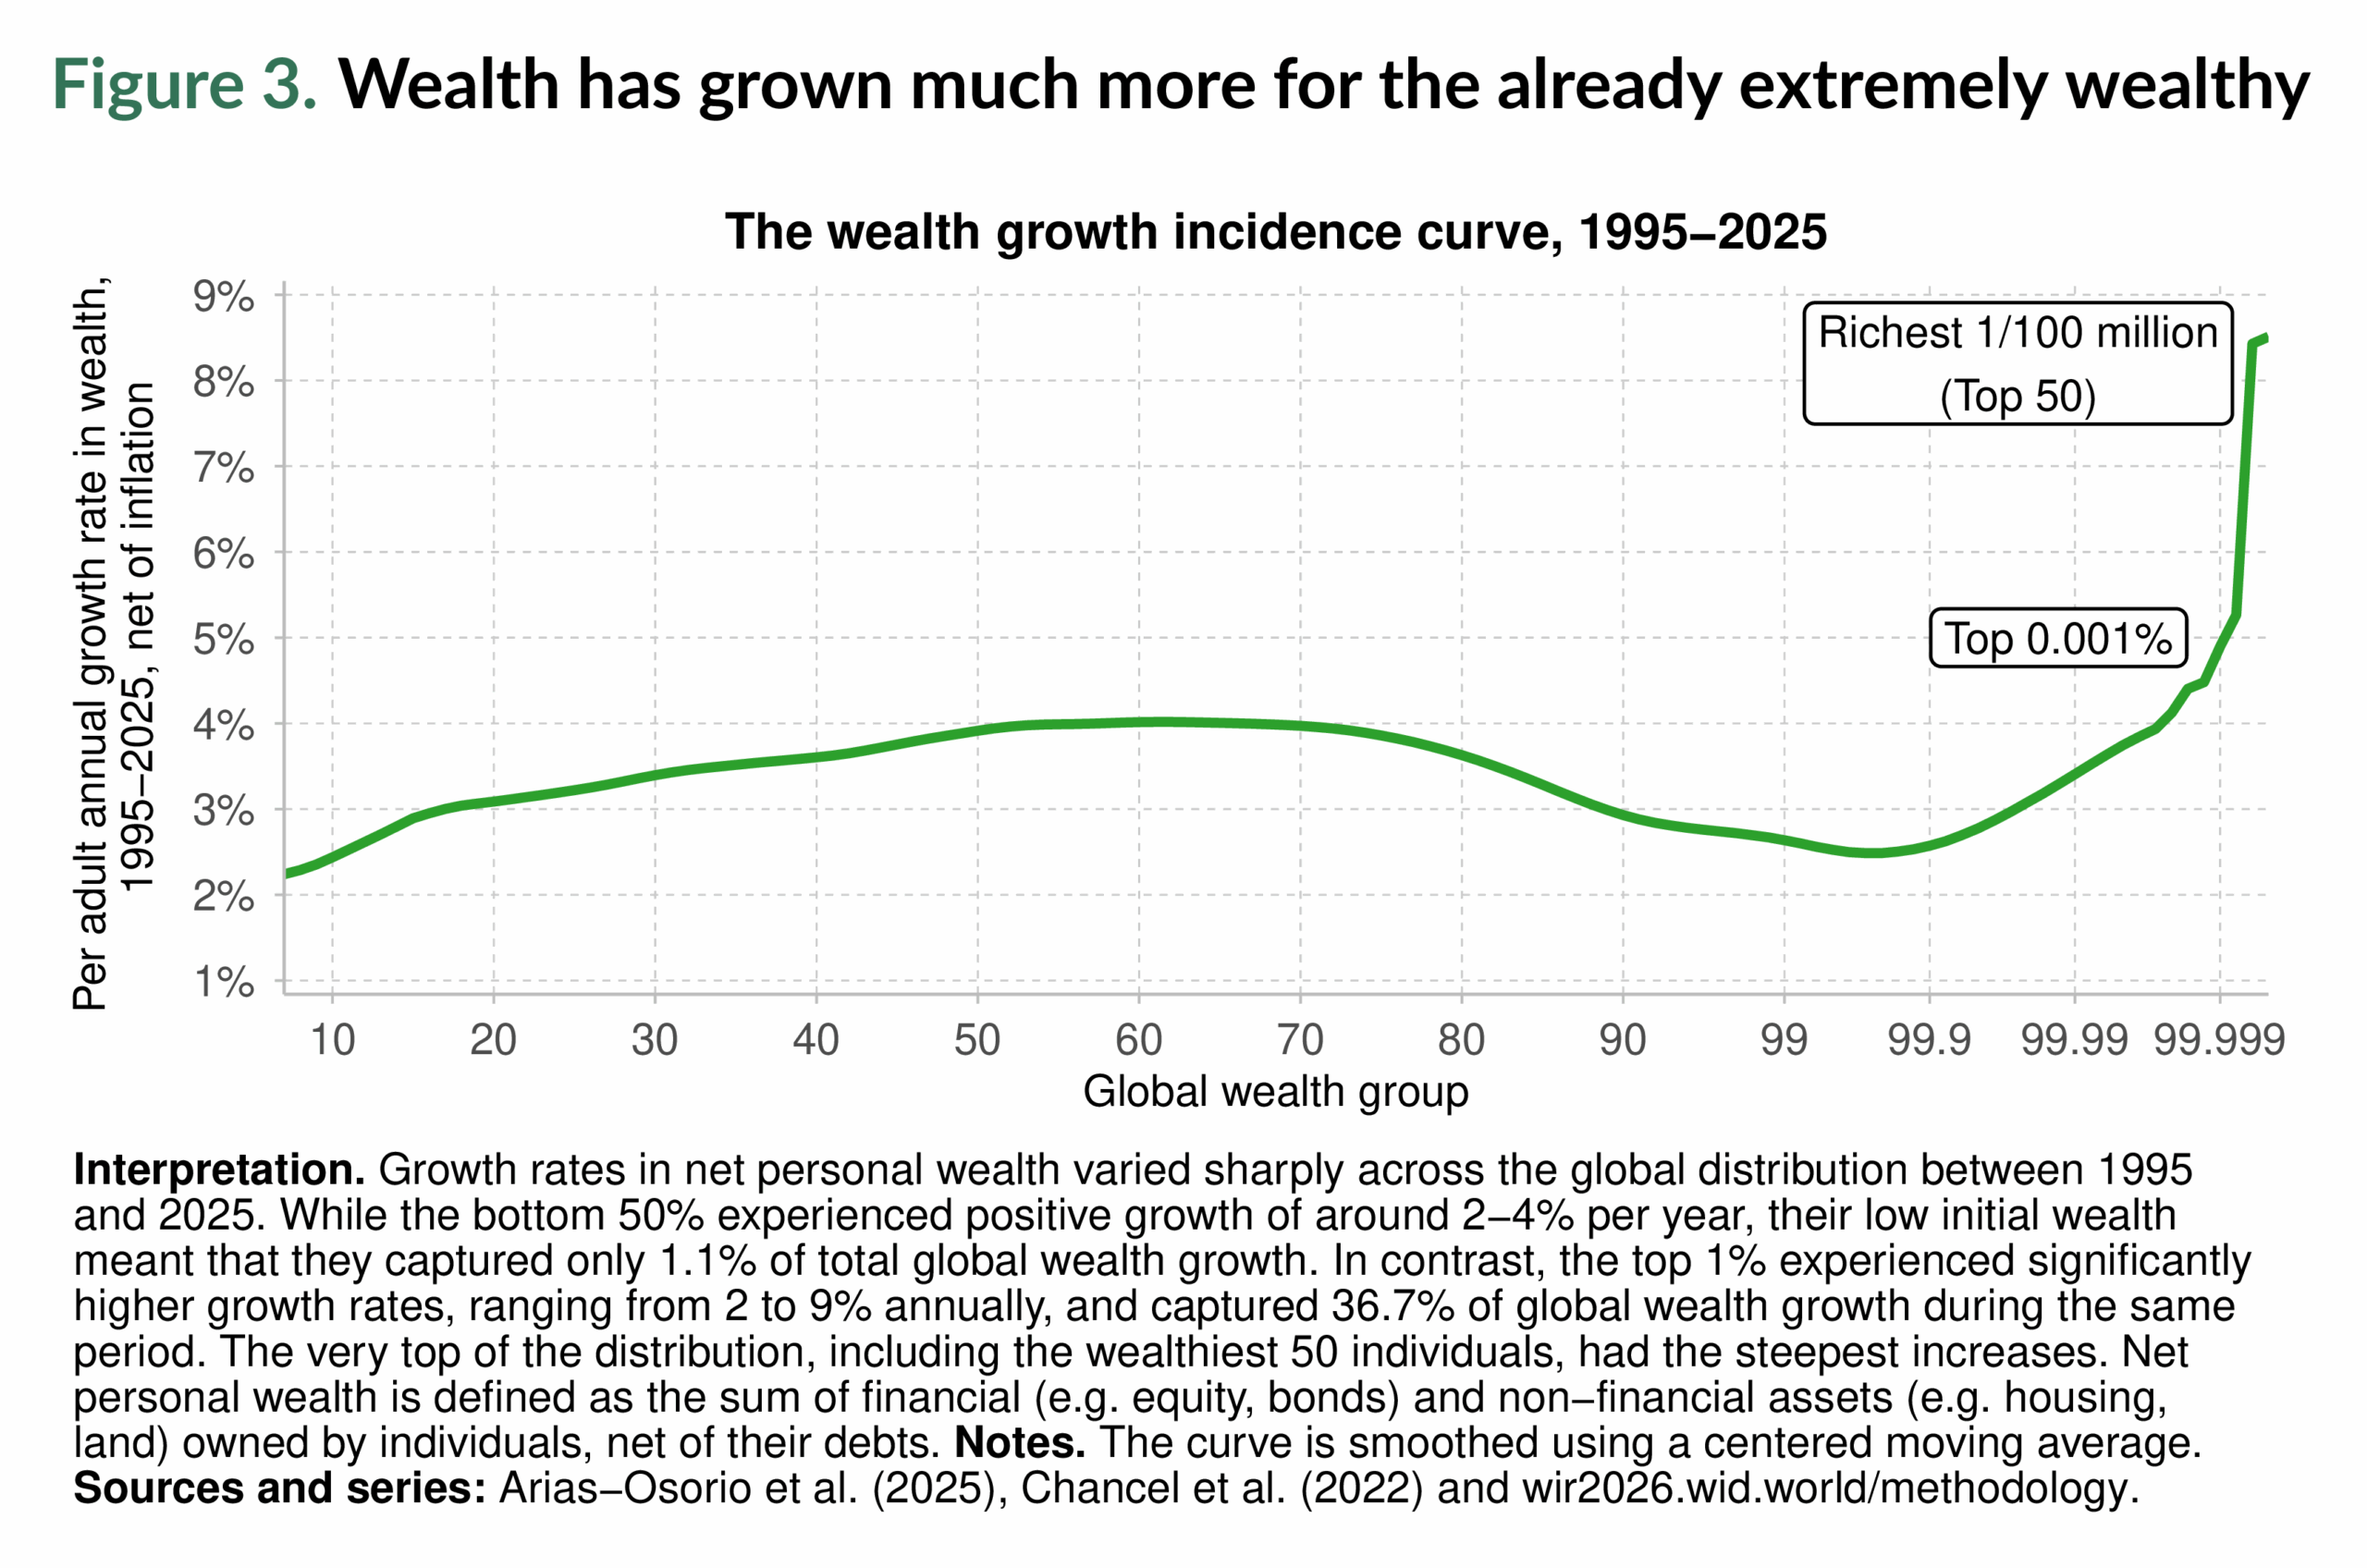
The result is a world in which a tiny minority commands unprecedented financial power, while billions remain excluded from even basic economic stability.
Inequality and climate change
The climate crisis is a collective challenge but also a profoundly unequal one. Figure 4 shows that the poorest half of the global population accounts for only 3% of carbon emissions associated with private capital ownership, while the top 10% account for 77% of emissions. The wealthiest 1% alone account for 41% of private capital ownership emissions, almost double the amount of the entire bottom 90% combined.

This disparity is about vulnerability. Those who emit the least, largely populations in low-income countries, are also those most exposed to climate shocks. Meanwhile, those who emit the most are better insulated, with resources to adapt to or avoid the consequences of climate change. This unequal responsibility is therefore also an unequal distribution of risk. Climate inequality is both an environmental and a social crisis.
Gender inequality
Inequality is not only a question of income, wealth, or emissions. It is also embedded in the structures of everyday life, shaping whose work is recognized, whose contributions are rewarded, and whose opportunities are constrained. Among the most persistent and pervasive divides is the gap between men and women.
Globally, women capture just over a quarter of total labor income, a share that has barely shifted since 1990. When analyzed by regions (Figure 5), in the Middle East & North Africa, women’s share is only 16%; in South & Southeast Asia it is 20%; in Sub-Saharan Africa, 28%; and in East Asia, 34%. Europe, North America & Oceania, as well as Russia & Central Asia, perform better, but women still capture only about 40% of labor income.

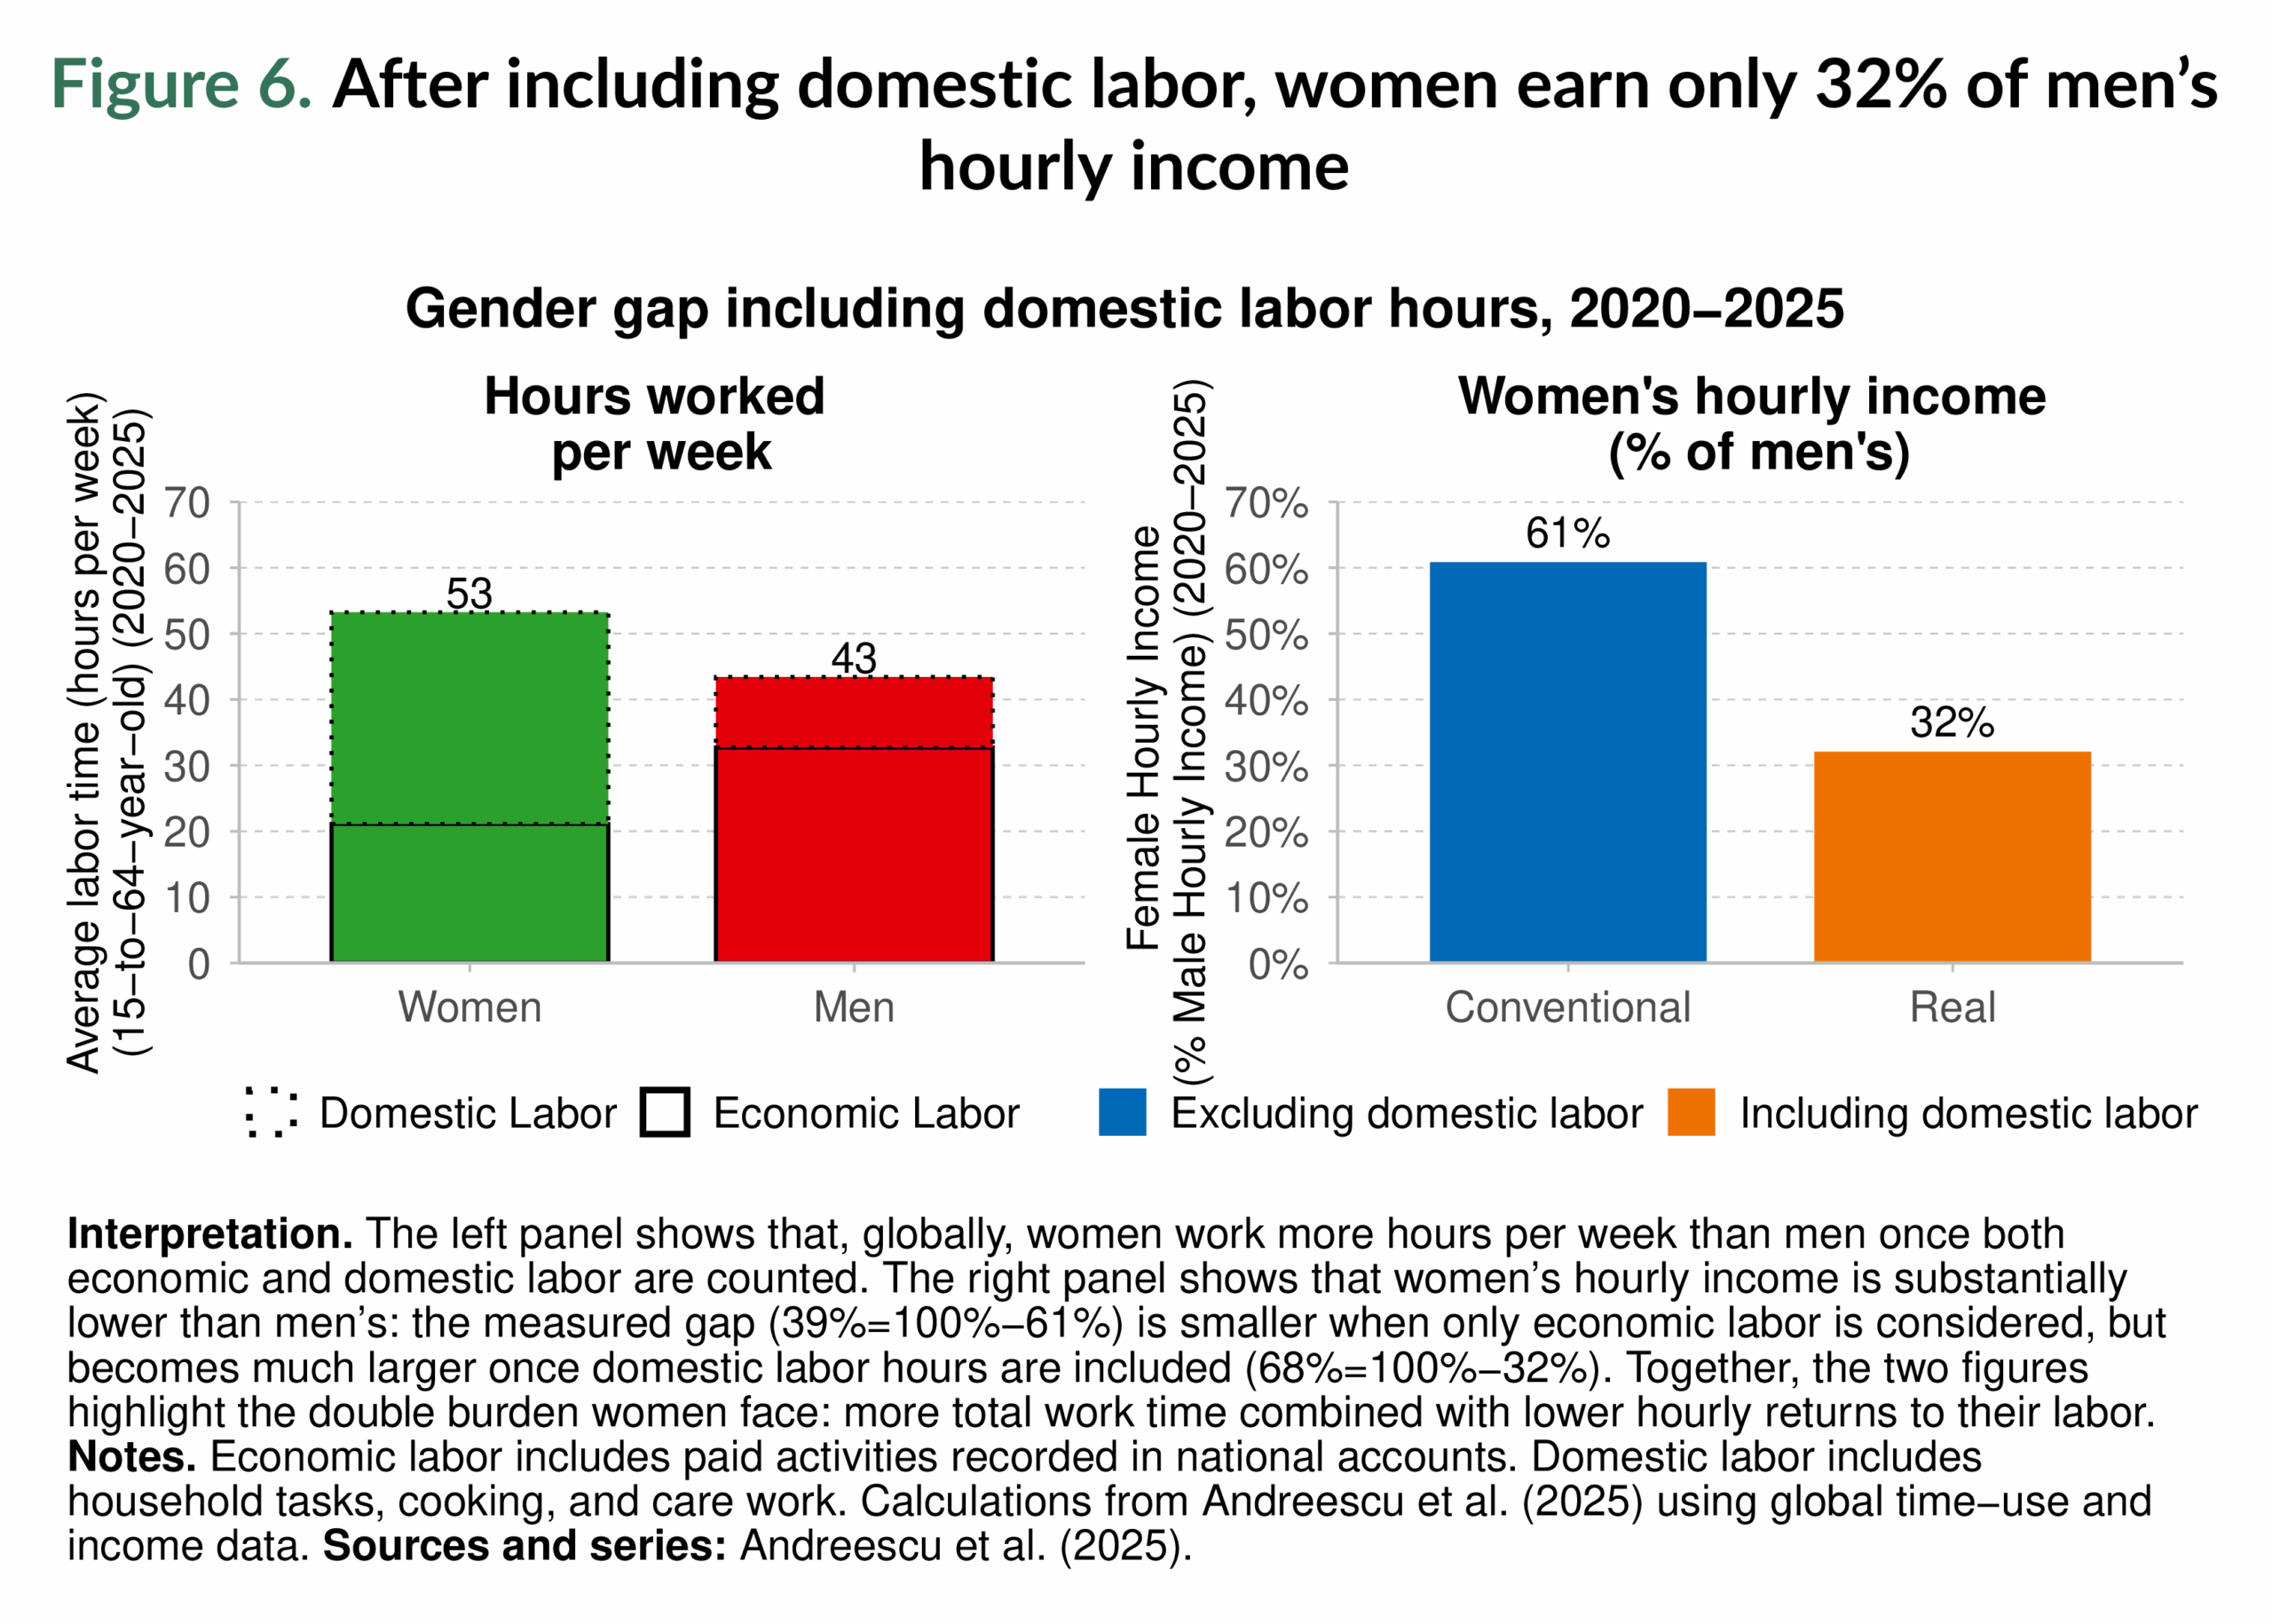
Women continue to work more and earn less than men. Figure 6 shows that women work more hours than men, on average 53 hours per week compared to 43 for men, once domestic and care work is taken into account. Yet their work is consistently valued less. Excluding unpaid work, women earn only 61% of men’s hourly income; when unpaid labor is included, this figure falls to just 32%. These disproportionate responsibilities restrict women’s career opportunities, limit political participation, and slow wealth accumulation. Gender inequality is therefore not only a question of fairness but also a structural inefficiency: economies that undervalue half of their population’s labor undermine their own capacity for growth and resilience.
Inequality between regions
The global averages conceal enormous divides between regions. Figure 7 shows that the world is split into clear income tiers: high-income regions such as North America & Oceania and Europe; middle-income groups including Russia & Central Asia, East Asia, and the Middle East & North Africa; and very populous regions where average incomes remain low, such as Latin America, South & Southeast Asia, and Sub-Saharan Africa

The contrasts are stark, even when correcting for price differences across regions. An average person in North America & Oceania earns about thirteen times more than someone in Sub-Saharan Africa and three times more than the global average. Put differently, average daily income in North America & Oceania is about €125, compared to only €10 in Sub-Saharan Africa. And these are averages: within each region, many people live with far less.
Figure 8 highlights this point by showing the distribution of income and wealth within regions. Income is distributed unequally everywhere, with the top 10% consistently capturing far more than the bottom 50%. But when it comes to wealth, the concentration is even more extreme. Across all regions, the wealthiest 10% control well over half of total wealth, often leaving the bottom half with only a tiny fraction.

Inequality is enormous both across regions and within them. Some regions, like North America & Oceania, enjoy higher average income and wealth than the world average, yet still exhibit large internal disparities. Others, like Sub-Saharan Africa, face the double burden of low average levels and extreme internal inequality.
A distinctive strength of the World Inequality Database (wid.world) is its ability to track income and wealth across the entire distribution, from the poorest individuals to the very richest, while also providing information at the country level for several years. This makes it possible to examine inequality not only between and across regions,
but also within and across individual countries.
Figure 9 illustrates this with the Top 10%/Bottom 50% (T10/B50) income ratio, a straightforward yet powerful measure that asks: On average, how many times more does the top 10% earn compared to the poorest half? The answer reveals large inequalities within countries.

While inequality within countries is severe everywhere, its intensity follows clear patterns. Europe and much of North America & Oceania are among the least unequal, though even here, the top groups capture far more wealth than the bottom half. The United States stands out as an exception, with higher levels of inequality than its high-income peers. At the other end of the spectrum, Latin America, southern Africa, and the Middle East & North Africa combine low incomes for the bottom 50% with extreme concentration at the top, which yields some of the highest T10/B50 income gaps worldwide.
Redistribution, taxation, and evasion
Studying inequality across countries and over time reveals that policy can indeed reduce inequality. Figure 10 shows how progressive taxation and, especially, redistributive transfers have significantly reduced inequality in every region, particularly when systems are well designed and consistently applied. In Europe and North America & Oceania, tax-and-transfer systems consistently cut income gaps by more than 30%. Even in Latin America, redistributive policies introduced after the 1990s have made large progress in narrowing gaps. The evidence shows that in every region, redistributive policies have been effective in reducing inequality, but with with large variations.

The global inequality in access to human capital remains enormous: it stands at levels that are arguably much larger than most people imagine. In 2025, average education spending per child in Sub-Saharan Africa stood at just €220 (PPP), compared with €7,430 in Europe and €9,020 in North America & Oceania (see Figure 11) (a gap of more than 1 to 40, i.e., approximately three times as much as the gap in per capita GDP or net national income-NNI-). Such disparities shape life chances across generations, entrenching a geography of opportunity that exacerbates and perpetuates global wealth hierarchies.

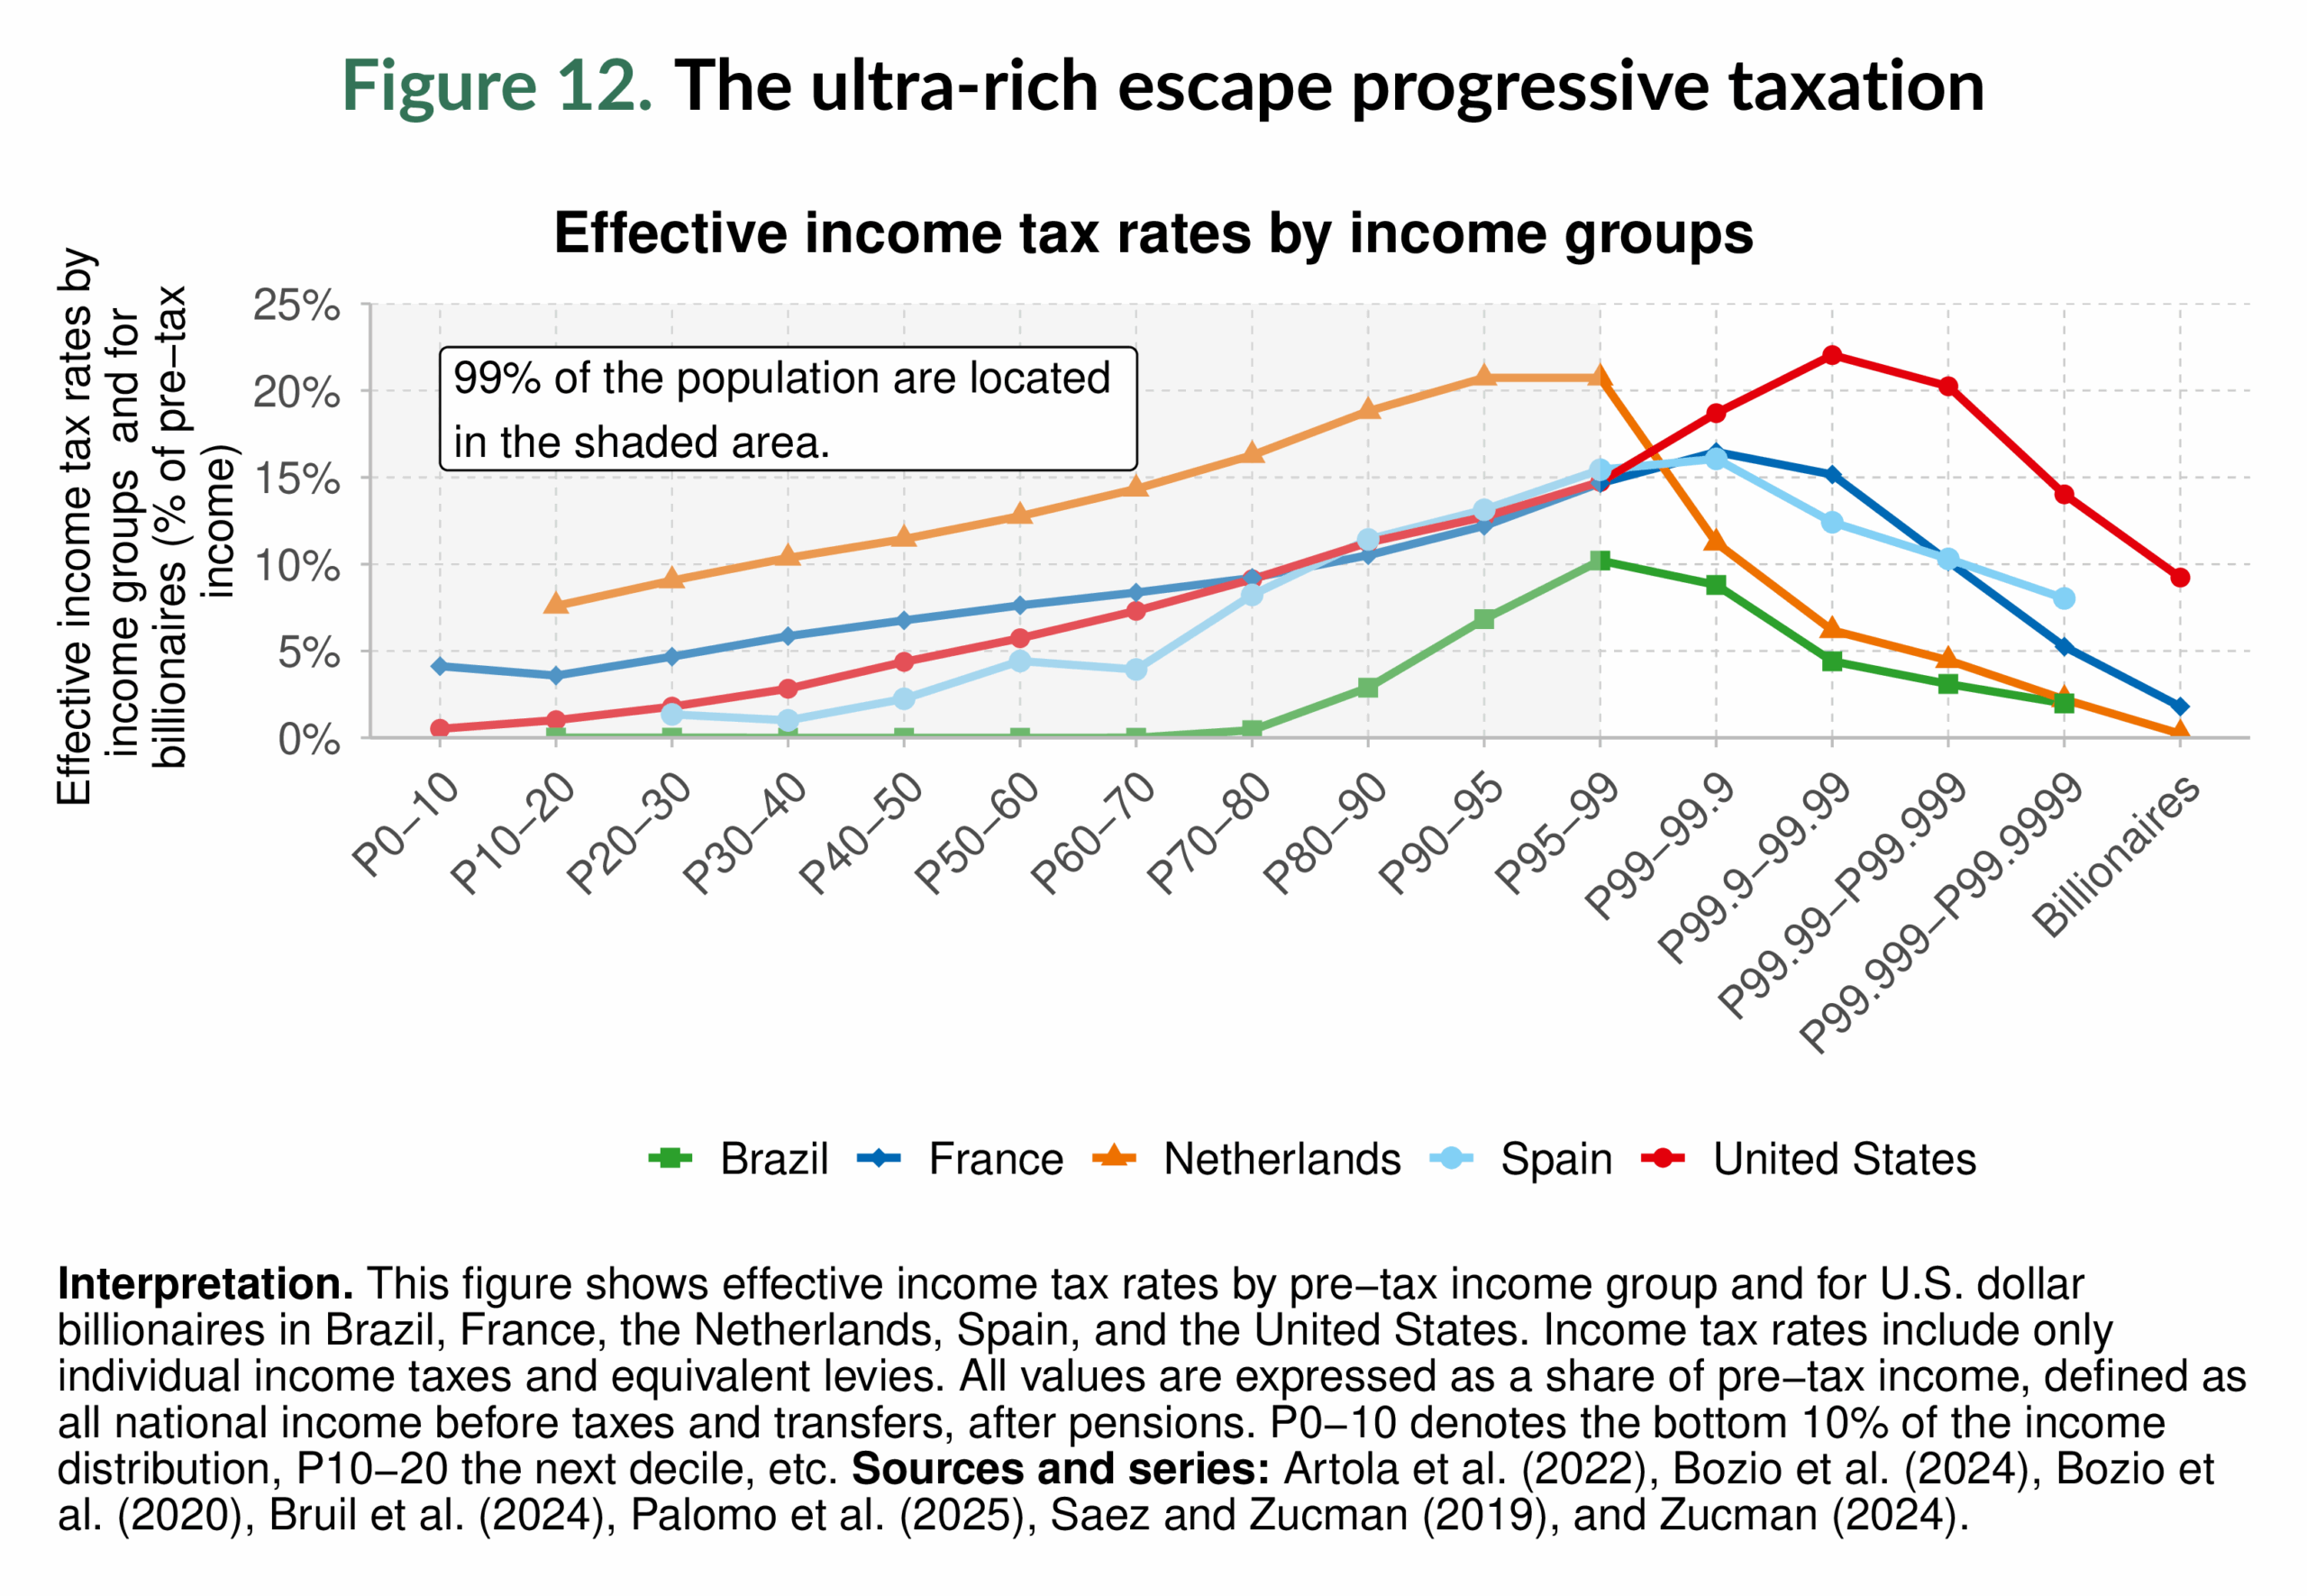
In addition, taxation often fails where it is most needed: at the very top of the distribution. Figure 12 reveals how the ultra-rich escape taxation. Effective income tax rates climb steadily for most of the population but fall sharply for billionaires and centi-millionaires. These elites pay proportionally less than most of the households that earn much lower incomes. This regressive pattern deprives states of resources for essential investments in education, healthcare, and climate action. It also undermines fairness and social cohesion by decreasing trust in the tax system. Progressive taxation is therefore crucial: it not only mobilizes revenues to finance public goods and reduce inequality, but also strengthens the legitimacy of fiscal systems by ensuring that those with the greatest means contribute their fair share.
Inequality due to the global financial system
Inequality is also deeply embedded in the global financial system. Figure 13 illustrates how the current international financial architecture is structured in ways that systematically generate inequality. Countries that issue reserve currencies can persistently borrow at lower costs, lend at higher rates, and attract global savings. By contrast, developing countries face the mirror image: expensive debts, low-yield assets, and a continuous outflow of income.

Persistent demand for “safe” assets such as U.S. Treasuries and European sovereign bonds, reinforced by central bank reserves, regulatory standards (i.e., Basel III), and the judgments of credit rating agencies, locks in this advantage (see Figure 14). The result is that rich countries consistently borrow more cheaply while investing in higher-yielding assets abroad, positioning themselves as financial rentiers at the expense of poorer nations.

The outcome is a modern form of structurally unequal exchange. While colonial powers once extracted resources to transform deficits into surpluses, today’s advanced economies achieve similar results through the financial system. Developing countries are driven to transfer resources outward, constrained in their ability to invest in education, healthcare, and infrastructure. This dynamic not only entrenches global inequality but also increases inequality within nations, as fiscal space for inclusive development is eroded.
Political cleavages and democracy
Economic divides do not stop at the marketplace; they spill directly into politics. Inequality shapes who is represented, whose voices carry weight, and how coalitions are built, or fail to be built. Figure 15 shows how the traditional class-based alignment of politics in Western democracies has broken down3. In the mid-20th century, lower-income and less educated voters largely supported left-wing parties, while wealthier and more educated groups leaned right, creating a clear class divide and rising redistribution.

Today, that pattern has fractured. First, education and income now point in different directions (see Figure 15), making broad coalitions for redistribution far harder to sustain. This evolution can be accounted for by the fact that educational expansion has come with a complexification of the class structure. For example, many high-degree but relatively low-income voters (e.g., teachers or nurses) currently vote for the left, while many voters with lower degrees but relatively higher income (e.g., self-employed or truck drivers) tend to vote for the right.
The even more striking evolution is the rise of territorial divides within countries. In many advanced democracies, gaps in political affiliations between large metropolitan centers and smaller towns have reached levels unseen in a century (see Figure 16). Unequal access to public services (education, health, transportation and other infrastructures), job opportunities, and exposure to trade shocks has fractured social cohesion and weakened the coalitions necessary for redistributive reform. As a consequence, working-class voters are now fragmented across parties on both sides of the aisle or left without strong representation, which limits their political influence and entrenches inequality. In order to reactivate the redistributive coalitions of the postwar era, it is critical to design more ambitious policy platforms benefiting all territories, as they successfully did in the past.

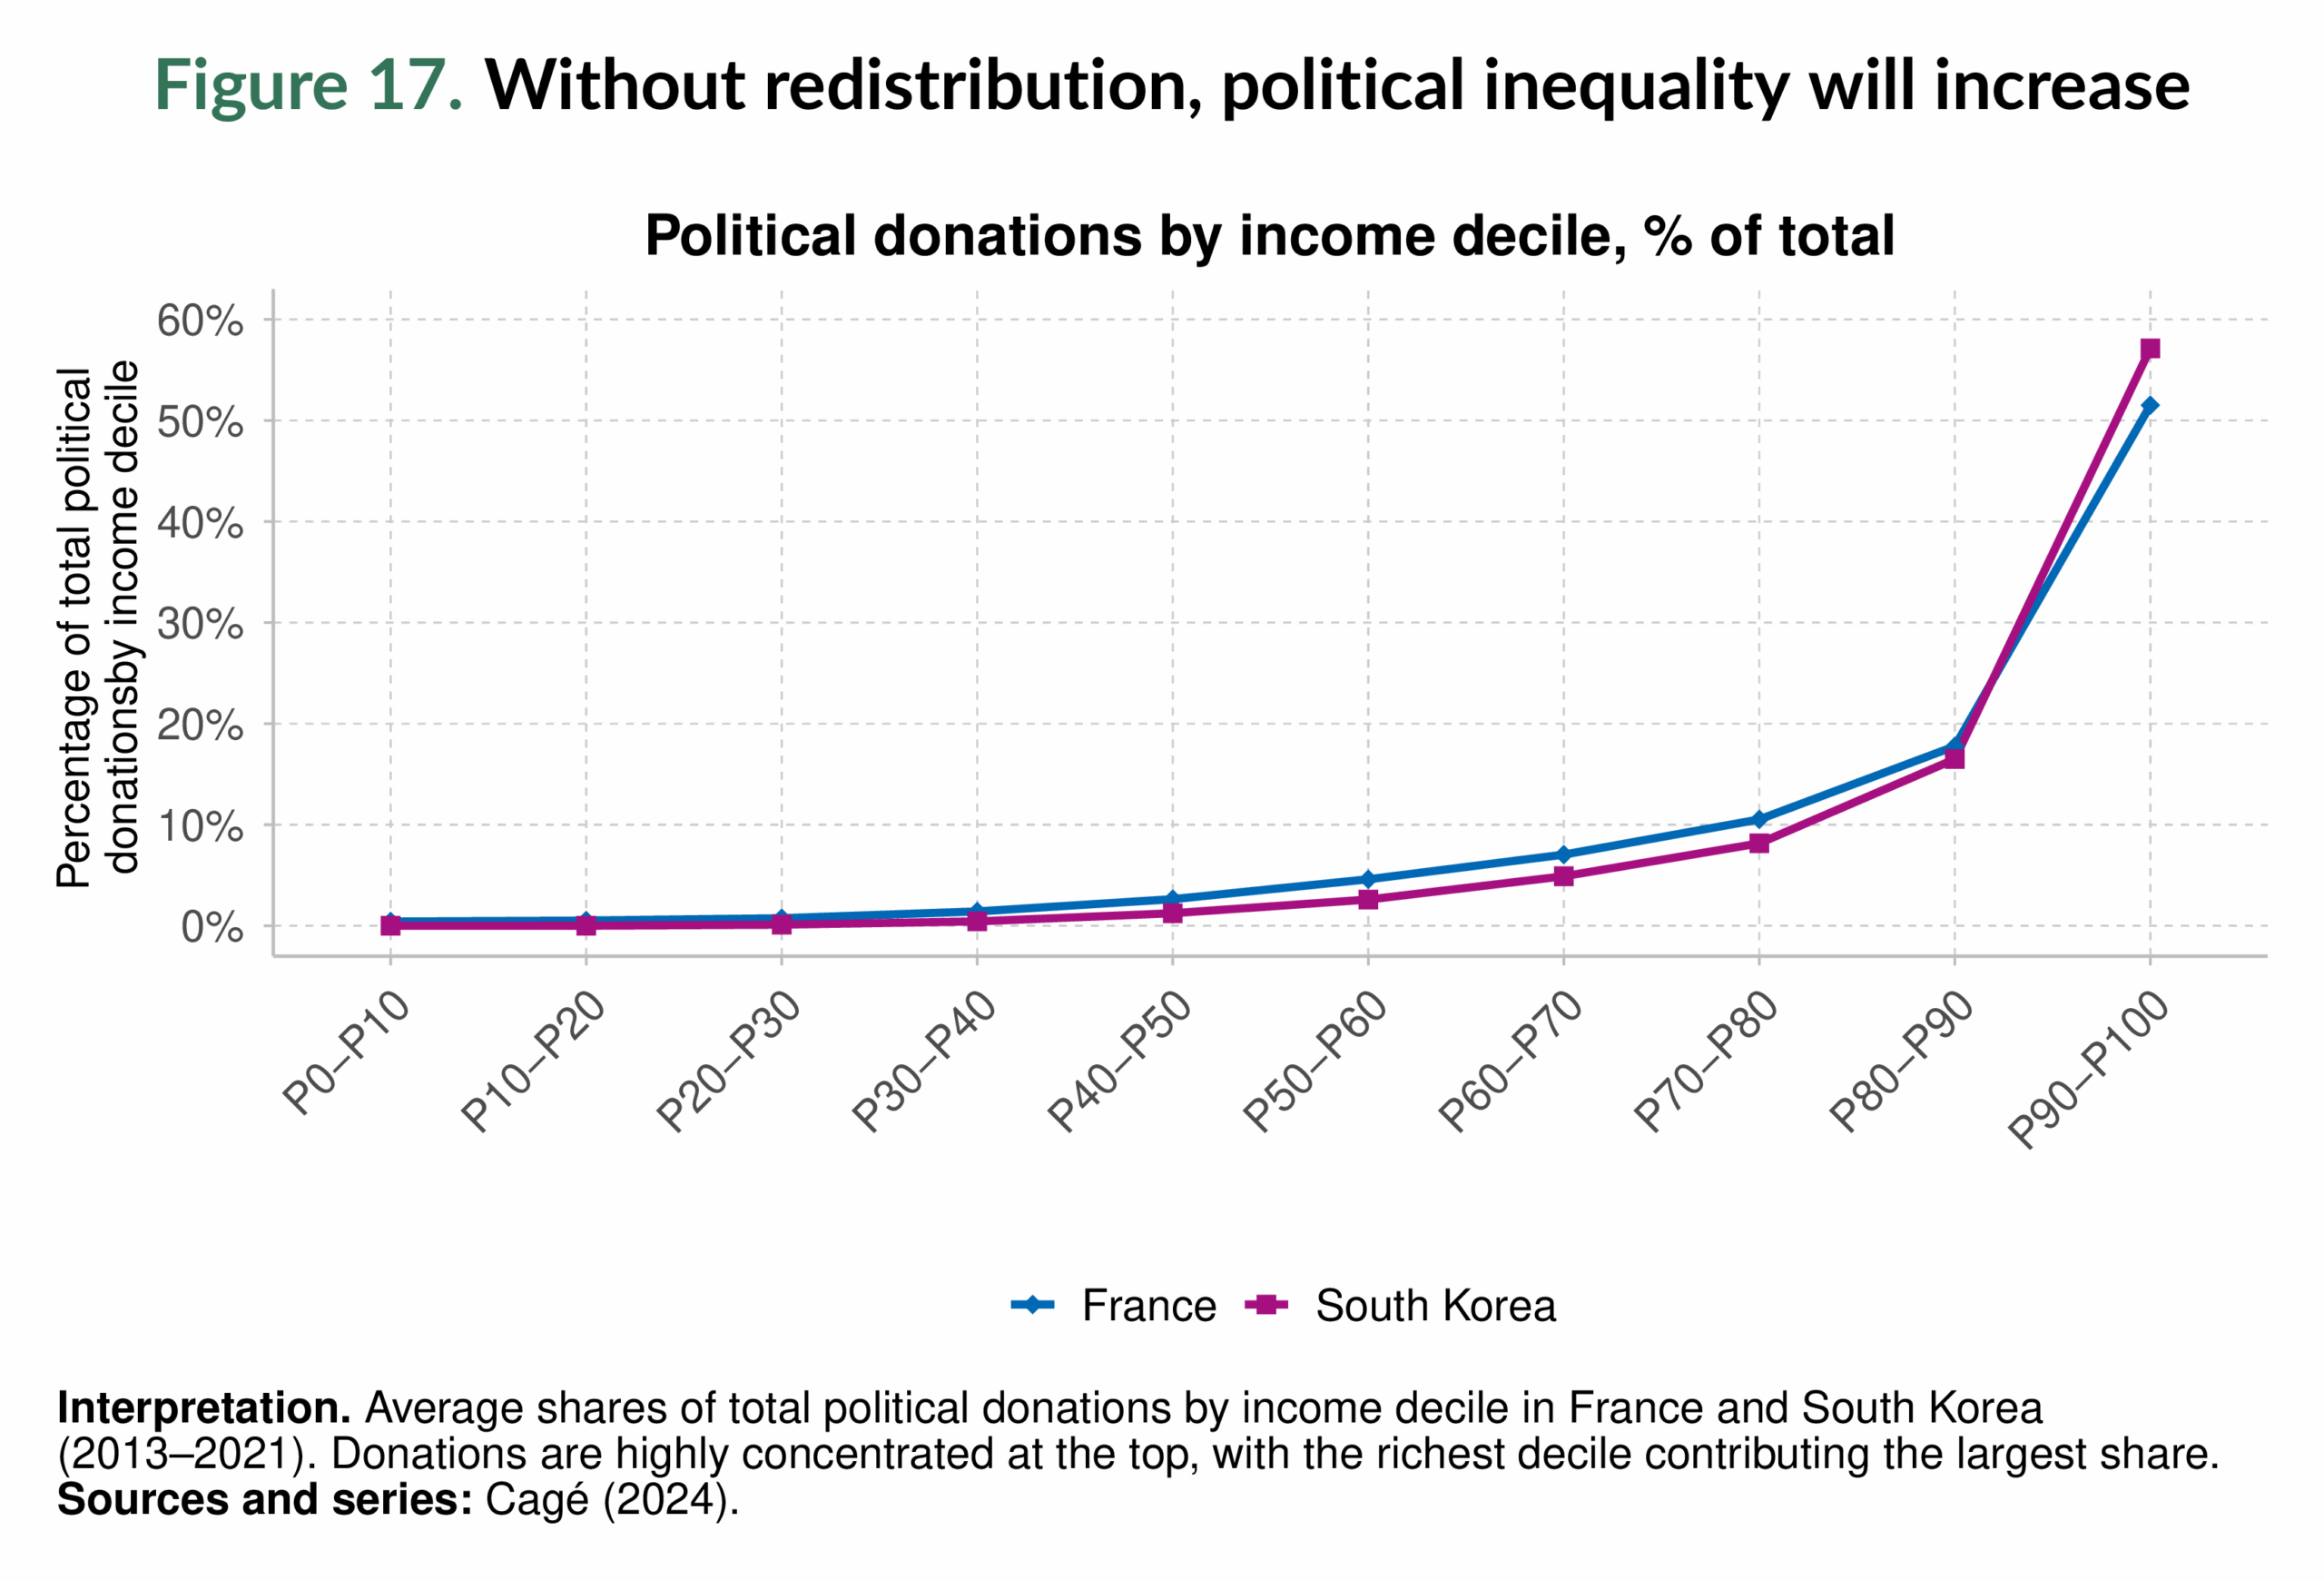
This fragmentation erodes the political foundations needed to tackle inequality and prevents the implementation of redistributive policies. Meanwhile, the influence of wealth in politics compounds the inequality in political influence. Figure 17 shows how campaign financing is heavily concentrated among the top earners: in France and South Korea, the richest 10% of citizens disproportionately provide the majority of political donations. This concentration of financial power amplifies elite voices, narrows the space for equitable policymaking, and further marginalizes the working majority.
Reducing inequality is a political choice. But fragmented electorates, underrepresentation of workers, and the outsized influence of wealth all work against the coalitions needed for reform. This reality can change. It reflects political choices about campaign finance rules, party strategies, and institutional design that can be reshaped with sufficient will. Building the conditions for consensus is therefore as central to reducing inequality as any specific policy instrument.
Policy directions
The evidence makes one conclusion clear: inequality can be reduced. There are a range of policies that, in different ways, have proven effective in narrowing gaps.
One important avenue is through public investments in education and health. These are among the most powerful equalizers, yet access to these basic services remains uneven and stratified. Public investment in free, high-quality schools, universal healthcare, childcare, and nutrition programs can reduce early-life disparities and foster lifelong learning opportunities. By ensuring that talent and effort, rather than background, determine life chances, such investments build more inclusive and resilient societies.
Another path is through redistributive programs. Cash transfers, pensions, unemployment benefits, and targeted support for vulnerable households can directly shift resources from the top to the bottom of the distribution. Where well designed, such measures have narrowed income gaps, strengthened social cohesion, and provided buffers against shocks, especially in regions with weaker welfare states.
Progress can also come from advancing gender equality. Reducing gender gaps requires dismantling the structural barriers that shape how work is valued and distributed. Policies that recognize and redistribute unpaid care work, through affordable childcare, parental leave that includes fathers, and pension credits for caregivers, are essential to leveling the playing field. Equally important are the strict enforcement of equal pay and
stronger protections against workplace discrimination. Addressing these imbalances ensures that opportunities and rewards are not determined by gender but by contribution and capability. Climate policy offers another key dimension: when poorly designed, it can enhance inequality, but well planned, it can also reduce it. Climate subsidies coupled with progressive taxation have the potential to accelerate the adoption of low-carbon technologies in a fair way. Taxes and regulations on luxury consumption or high-carbon investments can also help reduce emissions levels among the wealthiest groups.
Tax policy is another powerful lever. Fairer tax systems, where those at the very top contribute at higher rates through progressive taxes, not only mobilize resources but also strengthen fiscal legitimacy. Even modest rates of a global minimum tax on billionaires and centi-millionaires could raise between 0.45% and 1.11% of global GDP (see Figure 18) and could finance transformative investments in education, healthcare, and climate adaptation.

Inequality can also be reduced by reforming the global financial system. Current arrangements allow advanced economies to borrow cheaply and secure steady inflows, while developing economies face costly liabilities and persistent outflows. Reforms such as adopting a global currency, centralized credit and debit systems, and corrective taxes on excessive surpluses would expand fiscal space for social investment and reduce the unequal exchange that has long defined global finance.
Conclusion
Inequality is a political choice. It is the result of our policies, institutions, and governance structures. The costs of escalating inequality are clear: widening divides, fragile democracies, and a climate crisis borne most heavily by those least responsible. But the possibilities of reform are equally clear. Where redistribution is strong, taxation is fair, and social investment is prioritized, inequality narrows.
The tools exist. The challenge is political will. The choices we make in the coming years will determine whether the global economy continues down a path of extreme concentration or moves toward shared prosperity.
1 Private capital ownership–based emissions refer to greenhouse gas emissions produced by firms and other productive assets that are privately owned. These emissions are allocated to individuals in proportion to their ownership shares and exclude direct household emissions and emissions from publicly owned assets (see Chancel and Mohren (2025)).
2 See, for instance, Andreescu, Arias-Osorio, et al. (2025); Andreescu and Alice Sodano (2024); Arias-Osorio et al. (2025); Bharti and Mo (2024); Bauluz, Brassac, Clara Martínez-Toledano, Nievas, et al. (2025); Bauluz, Brassac, Clara Martínez-Toledano, Piketty, et al. (2024); Chancel, Flores, et al. (2025); Dietrich et al. (2025); El Hariri (2024); Flores and Zúñiga-Cordero (2024); Forward and Fisher-Post (2024); Gómez-Carrera, Moshrif, Nievas, and Piketty (2024); Gómez-Carrera, Moshrif, Nievas, Piketty, and Somanchi (2025); Loubes and Robilliard (2024); Nievas and Piketty (2025).
3 See also Gethin, Clara Martínez-Toledano, and Piketty (2021); Gethin, Clara Martínez-Toledano, and Piketty (2022); Gethin and Clara Martínez-Toledano (2025)


